Stat Unit |
|||||||||
|
|||||||||
|
|
|||||||||
|
The graphs below plot the data values in Distributions 1 and 2. For each plot, the mean is positioned across the graph. 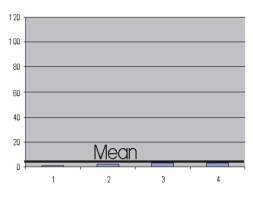
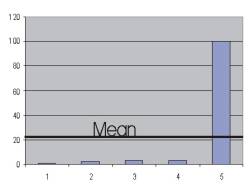
Notice that when a score of 100 is added to the second distribution, the mean is literally pulled in the direction of this larger score -- moving from a value of 2.25 in Distribution 1 to a value of 21.8 in Distribution 2. The significant change in the value of the mean for Distributions 1 and 2 confirms the mean's sensitivity to all scores. However, this level of sensitivity is not always an advantage. Let's see why. |
|
|
||||||||||
|
||||||||||